Changes in specific gene expression patterns often reflect adaptations in cellular functions to certain biological stimuli. These transcriptional changes can be assessed and quantitated using real time PCR (qPCR). This is an incredibly sensitive technique, and the quality of your results is directly correlated with the stringency in your workflow. Typically, the real time (qPCR) workflow involves extracting high quality RNA (RNA isolation 140 kb pdf file) from whole tissue or cultured cells, followed by bioanalysis (using the Agilent 2100 Bionanalyzer) of the quality and quantity of your RNA. This RNA is then normalized (quantity) for reverse transcription (106 kb pdf file) and equal amounts of cDNA are used in the qPCR reaction using the ABI ViiA7 (384, 96 well and TLDA format) or the ABI QuantStudio 7 (384 well format). There are two predominant methods of experimental qPCR quantitation: absolute and comparative. With absolute quantitation, copy-number information is obtained by comparing data with standard curves generated with plasmids of the target gene. With comparative (or ΔΔCt) quantitation, levels of expression of your gene of interest are quantitated relative to those of a housekeeping (reference) gene (100 kb pdf gene). Reactions can be set up using pre-validated fluorescent probes or with SYBR green dye in the master mix. Any primer sets used in combination with SYBR green must be validated first to optimize concentration, efficiency and R² values, using end-point PCR (with the ABI Veriti) and by running standard curves in your qPCR instrument of choice. Analysis software is available (ABI Expression Suite) for all real time PCR experiments. See below for detailed information on the qPCR workflow.
Many factors must be taken into consideration for a successful gene expression study, even long before any sample processing occurs. For example, in order to minimize experimental variability, efforts must be taken in carefully selecting proper control groups, ensuring that an adequate number of technical and biological replicates are incorporated into the study, that experimental conditions and tissue/cell isolation are all strictly recorded and reproduced with each animal/cell line, etc. Here are some important factors to consider when you design your study:
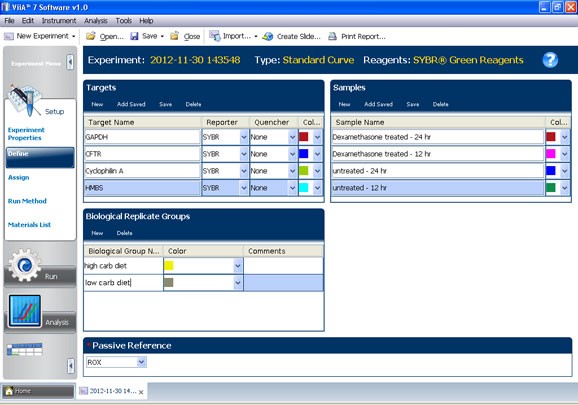
Now that you have designed your experiments carefully, there are many details to think about when setting up your actual qPCR experiment. Here is a breakdown of the qPCR workflow and things to think about at each step: