The purity (degree of contamination) and quality (intactness or integrity) of RNA are essential elements for methods which assess gene expression, such as real time qPCR and microarrays. Both methods require very high quality RNA for success. A contaminated sample can potentially lead to inhibition of the enzymatic components of the reverse transcription (reverse transcriptase) and the qPCR reactions (polymerase). A degraded sample can lead to misrepresentative data and inconsistency in reproducibility. Therefore, it is critical to assess not only RNA quantity, but purity and quality before undertaking gene expression experiments.
Here are some RNA facts (from Alberts, B. et al. (1994) Molecular Biology of the Cell):
In light of this, RNA integrity is particularly important in your qPCR reaction so that all mRNA species are adequately represented in your cDNA sample.
The purity of RNA can generally be assessed by spectrophotometric methods; all nucleotides (thus, RNA, ssDNA, and dsDNA) absorb at 260 nm, protein absorbs strongly at or near 280 nm, carbohydrates near 230 nm and phenol (the TRIzol reagent is a phenolic solution) has two absorbance peaks at 230 and ~270 nm. Therefore, the absorbance ratios at 260/280 nm and 260/230 nm can be used to assess RNA purity: an OD 260 / 280 nm ratio of 1.8-2.0 is indicative of high quality RNA whereas OD 260/230 nm values are commonly in the range of 2.0-2.2 for high quality RNA. If the ratio is appreciably lower than expected, it may indicate the presence of contaminants which absorb at either 280 or 230 nm. Genomic DNA contamination in a total RNA preparation can also falsely overestimate the amount of RNA present. These spectrophotometric measurements, however, give no information about the integrity of the RNA.
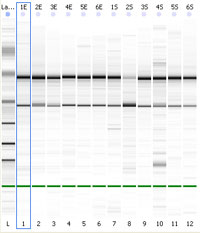
Since the ribosomal RNA (rRNA) makes up more than 80% of total RNA samples, the integrity of the major rRNA species (18S and 28S for mammalian rRNA) is routinely used to assess the RNA sample integrity. One can visualize the 28S and 18S ribosomal RNA bands with a fluorescent dye (ethidium bromide) following electrophoresis on a formaldehyde agarose gel. High quality RNA will have very little background in the lane, and the higher (28S) band will be approximately twice the intensity of the lower (18S) band. This method is very laborious (handling the apparatus and maintaining an RNase free environment), time consuming, requires large quantities of RNA in order to visualize and is not quantitative.
Bioanalysis using a micro-fluidic based electrophoresis system renders information on RNA quantity, purity and quality. The Agilent Bioanalyzer in the core labs is used for this purpose and for researchers at St. Michael’s Hospital the cost of consumables is covered by Research Facilities. The procedure requires very little nucleic acid (1 ul) and has a wide dynamic range as it is possible to read from nanogram (total RNA Nano kit) down to picogram quantities of RNA (total RNA Pico kit). The bioanalyzer calculates two RNA quality measurements (the 28S/18S ribosomal RNA ratio and the RNA integrity number, RIN) and it also gives you a more accurate quantitation of mRNA for normalization of your RNA template in reverse transcription.
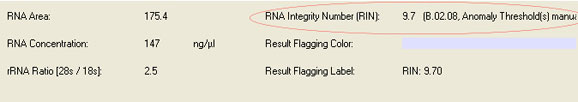
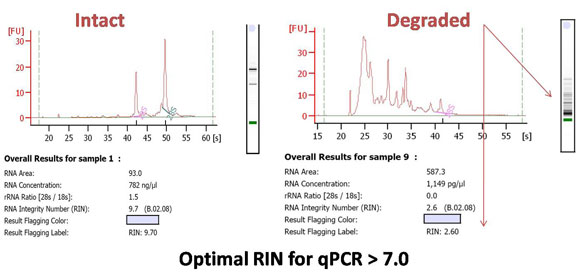
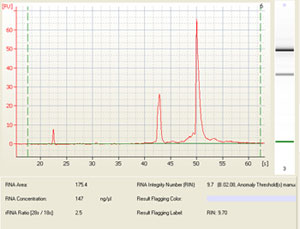
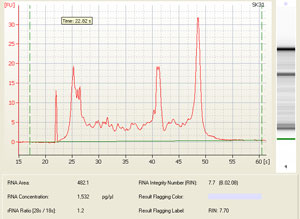
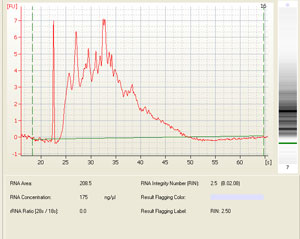
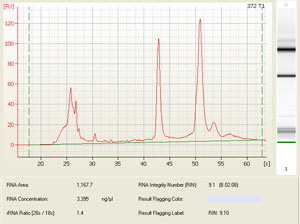
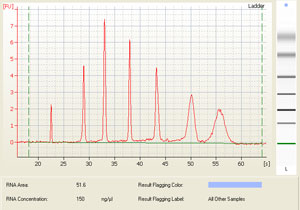
The results are given as both an electropherogram for quantitation and gel for visual inspection of RNA quality. The quantity of RNA is approximated by taking the area under the 28S and 18S rRNA peaks of the electropherogram, (which constitutes approximately 90% of the total RNA in your sample). The quality is reflected in the 28S/18S ratio as well as a RIN (RNA integrity number), which takes the entire electrophoretic trace into account. The RIN software algorithm allows for the classification of riboeukaryotic total RNA, based on a numbering system from 1 to 10, with 1 being the most degraded profile and 10 being the most intact.
Ensuring that your RNA samples are comparable in both purity and quality will make certain that variability is reduced across your biological replicates. Furthermore, starting with low quality RNA may negatively affect results from downstream applications which are labor intensive, time consuming and, often, expensive. It is recommended that a RIN higher than 5 be used for as a measure of decent RNA integrity, while a RIN of greater than 8 is used as perfect RNA integrity for downstream applications. It is recommended that RNA with a RIN of >7 be used for downstream qPCR applications. For a comprehensive article describing the effect of RNA integrity on real time PCR performance, see the article by Fleige and Pfaffl (224 kbpdf file).
Sample electropherogram from Agilent Bioanalysis (and corresponding results table showing RNA integrity number (RIN), rRNA ratio (28s/18s) and RNA concentration:
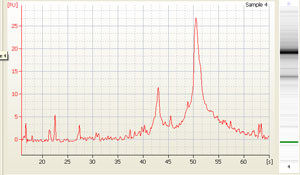
Other possible scenarios affecting RNA quality and qPCR results:
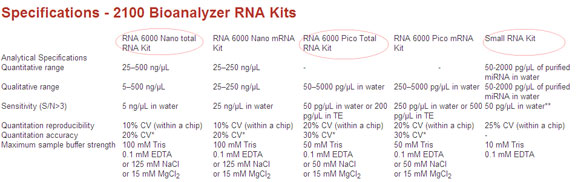
Depending on your predicted RNA yield, you can choose between several chips for bioanalysis. Here is an overview of the different kits available and highlighted are the kits available in the Keenan Research Centre for Biomedical Science Molecular Core: