When using multiple colours in flow cytometry or microscopy we quickly run into the problem of fluorescence spillover (spectral overlap) between fluorophores. This is an issue because if someone is looking at a cell labeled with FITC as an example, the cell would also appear fluorescently positive in other channels (i.e. the PE channel) because fluorophores emit light across a relatively broad spectrum.
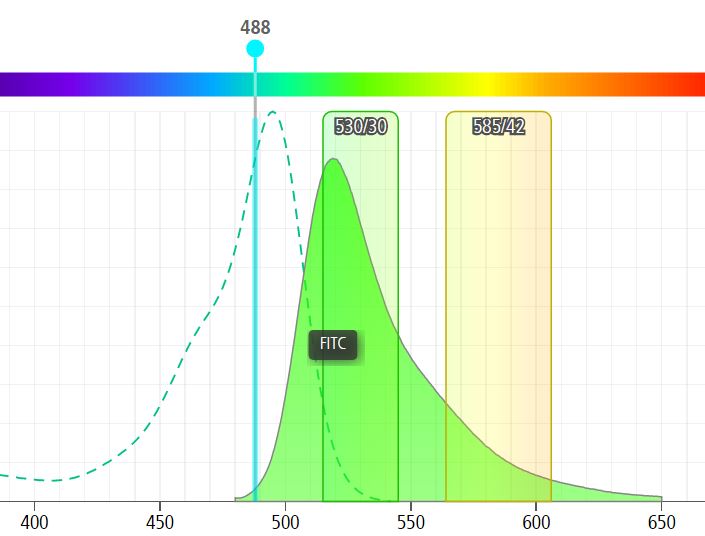
Figure 1: When excited by a 488nm laser, FITC emits a broad spectrum of wavelengths (filled green peak) varying from “green” which we measure as a true FITC signal at 530nm (530/30 bandpass filter shown) to yellow/orange light which spills into the PE detector (here the 585/42 bandpass filter).
So the problem becomes obvious if we are asking which cells are positive: 1) only for FITC, 2) only for PE, and 3) double-positive for FITC and PE. If we do nothing but label cells with FITC we would pick up ~45% of the total emitted FITC fluorescence (filled green peak) in the FITC channel. That same cell would look dimly positive for PE even though there is no PE marker there (~13% of the FITC fluorescent peak spills into the PE detector).
We deal with this through compensation which requires single-stained controls. These controls could be cells stained ONLY for FITC and a second control stained ONLY for PE. Alternatively these controls can be antibody capture beads stained with FITC and separately for PE. Beads actually work better in most cases and can be re-used several times over, making them cheap and very convenient. Links to several available compensation beads are at the bottom of this page.
Compensation (beads or cells) allows us to determine how much light is spilling over into other detector and to subtract that spillover (in this theoretical example we would take 13% of the FITC signal out of the PE channel and be left with a FITC+, PE- cell which is correct). Your first step is to setup the instrument and establish PMT voltages. Compensation is done AFTER setting your PMT voltages since if we were to make the PE detector more sensitive by increasing the voltage it would amplify the 13% spillover to a much larger percentage.
Often software packages do NOT show you that compensation has been done accurately. In order to see if your compensation is correct I recommend setting up an “n x n” matrix of dot plots, where “n” is the number of colours you are looking at. An example is below and basically you are looking for all of your populations to move perfectly laterally or vertically and not look like curving crab claws.
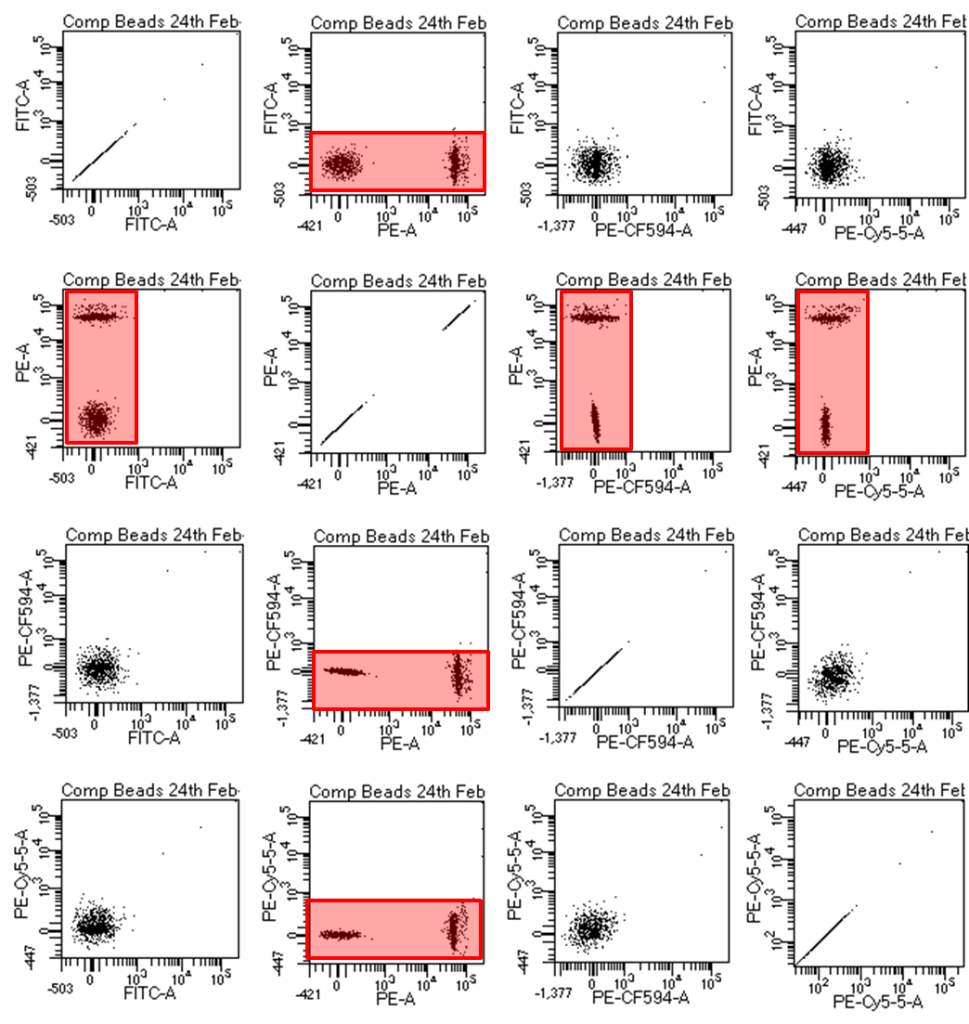
Figure 2: The so-called n x n matrix shows dotplots of all combinations of fluorophores. If you have colours 1,2,3, and 4 you can create this matrix by making the Y axes of your first column all fluorophore 1, column 2 all set to fluorophore 2, etc. Then change the X axes in row 1 to fluorophore 1, row 2 set to fluorophore 2, etc. I usually make a global worksheet called compensation for this and at any time you can see that your compensation worked. The fluorescently positive beads/cells should be exactly straight out vertically or horizontally from the unstained beads/cells and this can be verified by ensuring they have the same MFI (median fluorescence intensity) for the fluorescence parameter that you are compensating. For example if FITC spills into the PE channel and compensation is done correctly, FITC labeled beads/cells should have the same PE MFI as do unstained beads/cells.